| Parameter | Purpose |
|---|---|
| --color | - Wireshark-like colourised output. - tshark --color |
| -z | - Statistics - There are multiple options available under this parameter. You can view the available filters under this parameter with: - tshark -z help- Sample usage. - tshark -z filter- View Protocol Hierarchy Statistics: - tshark -z io,phs- Each time you filter the statistics, packets are shown first, then the statistics provided. You can suppress packets and focus on the statistics by using the -q parameter. |
Statistics | Protocol Hierarchy
Protocol hierarchy helps analysts to see the protocols used, frame numbers, and size of packets in a tree view based on packet numbers. As it provides a summary of the capture, it can help analysts decide the focus point for an event of interest. Use the -z io,phs -q parameters to view the protocol hierarchy.
After viewing the entire packet tree, you can focus on a specific protocol as shown below. Add the udp keyword to the filter to focus on the UDP protocol.
Statistics | Packet Lengths Tree
The packet lengths tree view helps analysts to overview the general distribution of packets by size in a tree view. It allows analysts to detect anomalously big and small packets at a glance! Use the -z plen,tree -q parameters to view the packet lengths tree.
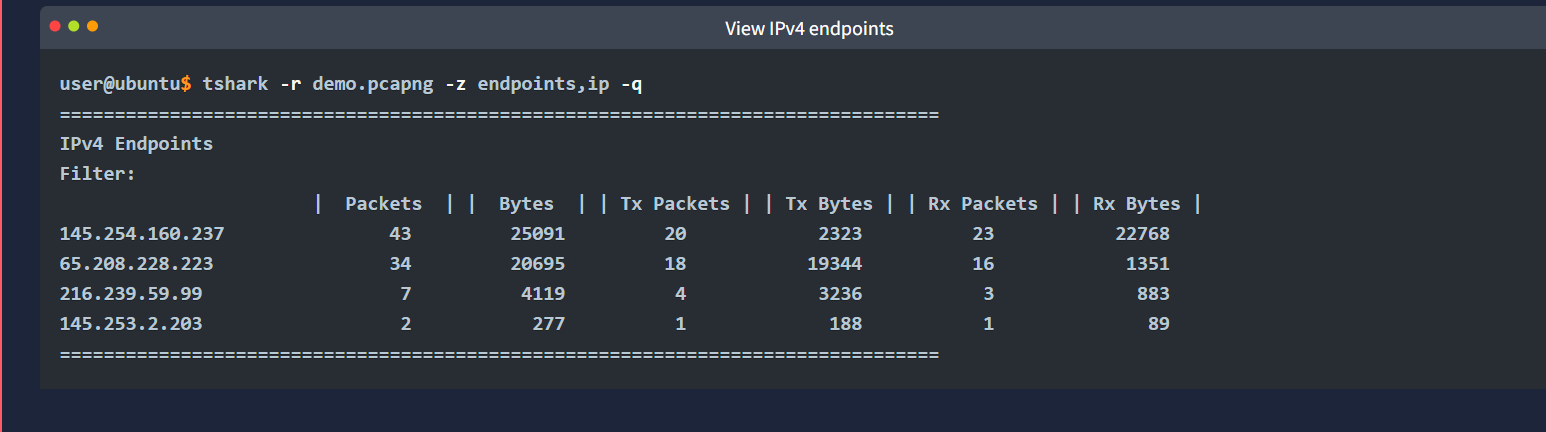
Statistics | Endpoints
Endpoints filter:
The endpoint statistics view helps analysts to overview the unique endpoints. It also shows the number of packets associated with each endpoint. If you are familiar with Wireshark, you should know that endpoints can be viewed in multiple formats. Similar to Wireshark, TShark supports multiple source filtering options for endpoint identification. Use the -z endpoints,ip -q parameters to view IP endpoints. Note that you can choose other available protocols as well.
Filters for the most common viewing options are explained below.
| Filter | Purpose |
|---|---|
| eth | - Ethernet addresses |
| ip | - IPv4 addresses |
| ipv6 | - IPv6 addresses |
| tcp | - TCP addresses - Valid for both IPv4 and IPv6 |
| udp | - UDP addresses - Valid for both IPv4 and IPv6 |
| wlan | - IEEE 802.11 addresses |
Statistics | Conversations
Conversation Filter:
The conversations view helps analysts to overview the traffic flow between two particular connection points. Similar to endpoint filtering, conversations can be viewed in multiple formats. This filter uses the same parameters as the "Endpoints" option. Use the -z conv,ip -q parameters to view IP conversations.
Statistics | Expert Info
The expert info view helps analysts to view the automatic comments provided by Wireshark.
Use the -z expert -q parameters to view the expert information.
Statistics | IPv4 and IPv6
This option provides statistics on IPv4 and IPv6 packets, as shown below. Having the protocol statistics helps analysts to overview packet distribution according to the protocol type. You can filter the available protocol types and view the details using the -z ptype,tree -q parameters.
Having the summary of the hosts in a single view is useful as well. Especially when you are working with large captures, viewing all hosts with a single command can help you to detect an anomalous host at a glance. You can filter all IP addresses using the parameters given below.
- IPv4:
-z ip_hosts,tree -q - IPv6:
-z ipv6_hosts,tree -q
For complex cases and in-depth analysis, you will need to correlate the finding by focusing on the source and destination addresses. You can filter all source and destination addresses using the parameters given below.
- IPv4:
-z ip_srcdst,tree -q - IPv6:
-z ipv6_srcdst,tree -q
In some cases, you will need to focus on the outgoing traffic to spot the used services and ports. You can filter all outgoing traffic by using the parameters given below.
- IPv4:
-z dests,tree -q - IPv6:
-z ipv6_dests,tree -q
Statistics | DNS
This option provides statistics on DNS packets by summarising the available info. You can filter the packets and view the details using the -z dns,tree -q parameters.
Statistics | HTTP
This option provides statistics on HTTP packets by summarising the load distribution, requests, packets, and status info. You can filter the packets and view the details using the parameters given below.
Packet and status counter for HTTP: -z http,tree -q Packet and status counter for HTTP2: -z http2,tree -q Load distribution: -z http_srv,tree -q Requests: -z http_req,tree -q Requests and responses: -z http_seq,tree -q
CLI | Streams, Objects and Credentials
Follow Stream
This option helps analysts to follow traffic streams similar to Wireshark. The query structure is explained in the table given below.
| Main Parameter | Protocol | View Mode | Stream Number | Additional Parameter |
|---|---|---|---|---|
| -z follow | - TCP - UDP - HTTP - HTTP2 |
- HEX - ASCII |
0 | 1 | 2 | 3 ... | -q |
Note: Streams start from "0". You can filter the packets and follow the streams by using the parameters given below.
- TCP Streams:
-z follow,tcp,ascii,0 -q - UDP Streams:
-z follow,udp,ascii,0 -q - HTTP Streams:
-z follow,http,ascii,0 -q
Export Objects
This option helps analysts to extract files from DICOM, HTTP, IMF, SMB and TFTP. The query structure is explained in the table given below.
| Main Parameter | Protocol | Target Folder | Additional Parameter |
|---|---|---|---|
| --export-objects | - DICOM - HTTP - IMF - SMB - TFTP |
Target folder to save the files. | -q |
You can filter the packets and follow the streams by using the parameters given below.
--export-objects http,/home/ubuntu/Desktop/extracted-by-tshark -q
Credentials
This option helps analysts to detect and collect cleartext credentials from FTP, HTTP, IMAP, POP and SMTP. You can filter the packets and find the cleartext credentials using the parameters below.
-z credentials -q